Who prepares your Scope 2 report?
When a carbon report is requested, invoices are usually gathered and the calculation is done once a year. GenieBlocks calculates Scope 2 emissions from electricity consumption by block and site; the report comes from the same metered data.
Short answer
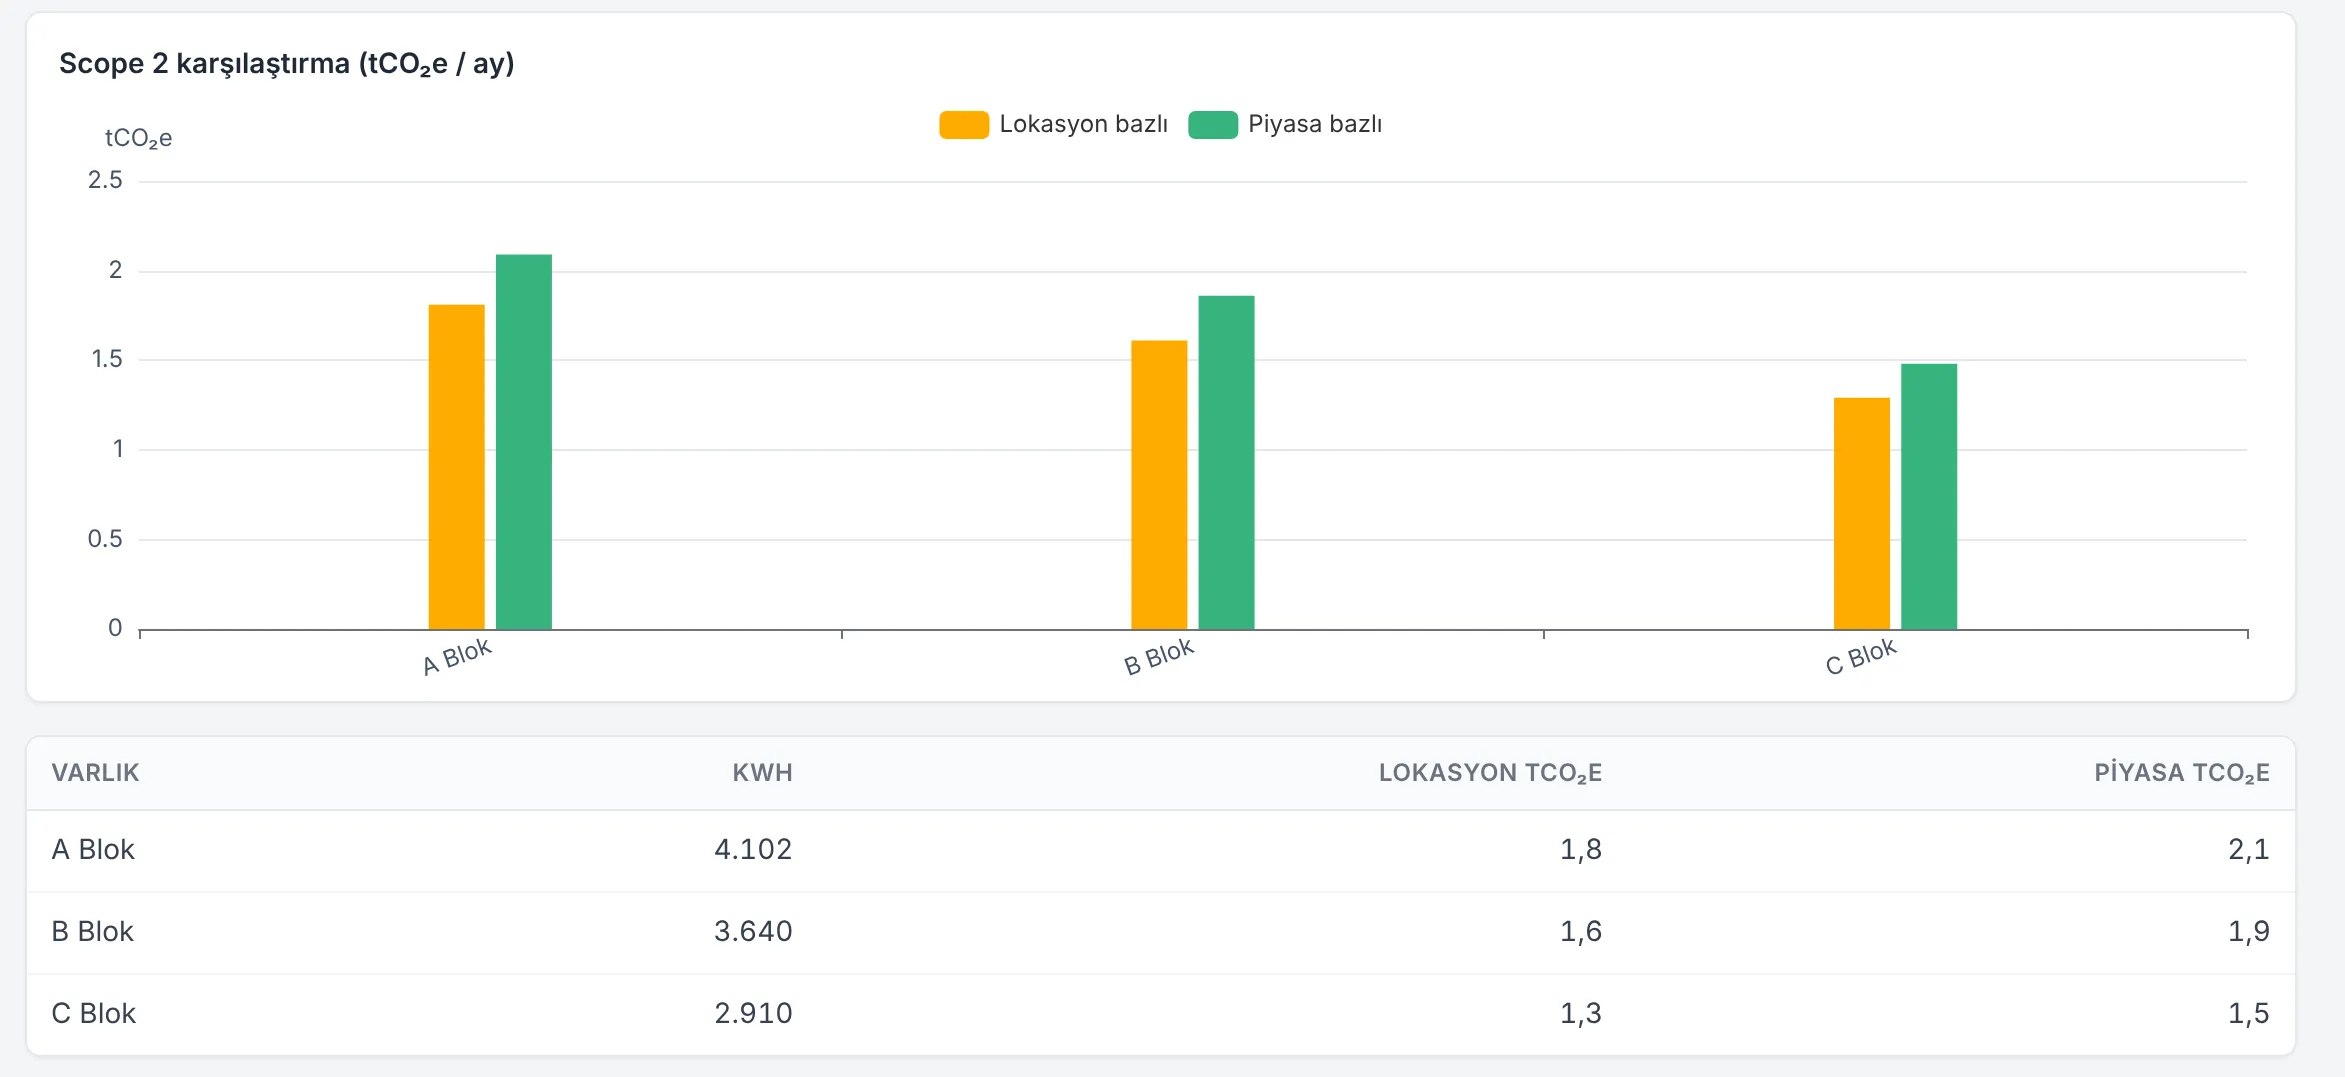
Scope 2 is calculated from metered electricity consumption, by block and site. Location-based and market-based results sit side by side.
Today and on GenieBlocks
| Today | On GenieBlocks |
|---|---|
| Invoices are gathered, a factor is applied, a spreadsheet is prepared. Changes in consumption in between go unseen. | Scope 2 is calculated from the same metered data, not from invoices; period and scope can be selected. |
| Which block or site accounts for most of the emissions? A single total does not tell you. | Results are shown by block and site. |
| Location-based and market-based methods give different results; how green energy share and certificates affect the figure should be clear. | Location-based and market-based results are compared by block and site. |
How we solve it
We take consumption from measurement
Scope 2 is calculated from the same metered data, not from invoices; period and scope can be selected.
We show both methods side by side
Location-based and market-based results are compared by block and site.
We produce the report from the same data
The carbon table goes into scheduled reports; a change in consumption carries into the emissions calculation.
How the platform addresses them
The modules that map to these problems. All modules run on one data backbone, in the same interface.
Carbon & Sustainability
Scope 2 location-based and market-based emissions.
Reports
Ready-made energy reports.
Savings Score
Savings score and targets.
Overview
Daily summary of the site, consumption and open events on one screen.
Read more on the topic
Common questions
Where does the Scope 2 figure come from?
From metered electricity consumption. Invoice spreadsheets do not have to be merged.
Is there a breakdown?
Yes. Location-based and market-based results sit side by side, by block and site.
Does this page calculate an emission amount?
No. It describes the method and the breakdown. Factors and amounts are not stated.
Let’s talk about your facility
Join the early access list; in the demo we show the platform and work out together how to start with the meters and systems you already have.